Total Sales
$2.34M
↑ 12.4% YoY
Total Profit
$286K
↑ 8.1% YoY
Margin %
12.2%
↓ 0.6 pts YoY
Orders
5,009
AOV $467
Star schema & DAX
FactSales (grain: order + product) → DimDate / DimProduct / DimCustomer / DimGeography. 12 measures cover Sales, Profit, Margin %, YTD, YoY. See data-model.md and dax-measures.md.
DimDate — DimProduct — DimCustomer — DimGeography —↘︎ FactSales ← Measures: Total Sales, Total Profit, Margin %, Sales YoY %, Profit YTD...
Dashboard
Power BI Desktop file in powerbi/sales-profit-dashboard.pbix. Theme theme.json matches portfolio (slate + teal). Screenshots below are exports; iframe embed is optional via Power BI Service publish-to-web.
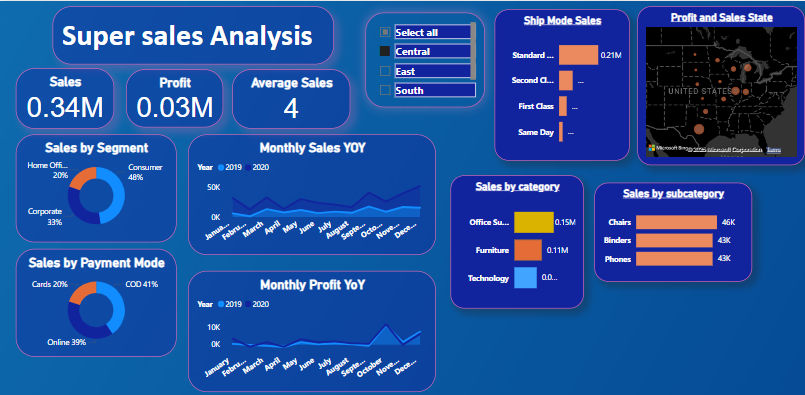
Overview page — KPI cards + sales vs profit trend + region/category slicers. Replace with
screenshots/dashboard-overview.png after export.
Sales by Region

Profit by Category & Margin
To embed live: Publish .pbix to Power BI Service → File → Embed → Publish to web → paste iframe here. Keep screenshots as fallback (recruiters often block iframes).
SQL — validation layer
All KPIs are first validated in SQL before DAX. See sql/02_kpi_queries.sql and sql/03_advanced_analysis.sql.
-- YoY example
WITH monthly AS (
  SELECT date_trunc('month', order_date) AS m, SUM(sales) AS sales
  FROM fact_sales GROUP BY 1
)
SELECT m, sales,
  LAG(sales,12) OVER (ORDER BY m) AS last_year,
  (sales - LAG(sales,12) OVER (ORDER BY m)) / NULLIF(LAG(sales,12) OVER (ORDER BY m),0) AS yoy_pct
FROM monthly;
Insights & Recommendations
- West leads profit, Central leaks margin — Central margin -4.2 pts vs avg despite 22% of sales.
- Furniture discounts >20% destroy profit on 12% of orders; Technology holds 16.8% margin.
- Top 10 customers = 18% profit — retention risk, need personalized play not blanket discount.
- Q4 volume up, margin down — holiday discounting; Q1 is most profitable per dollar.